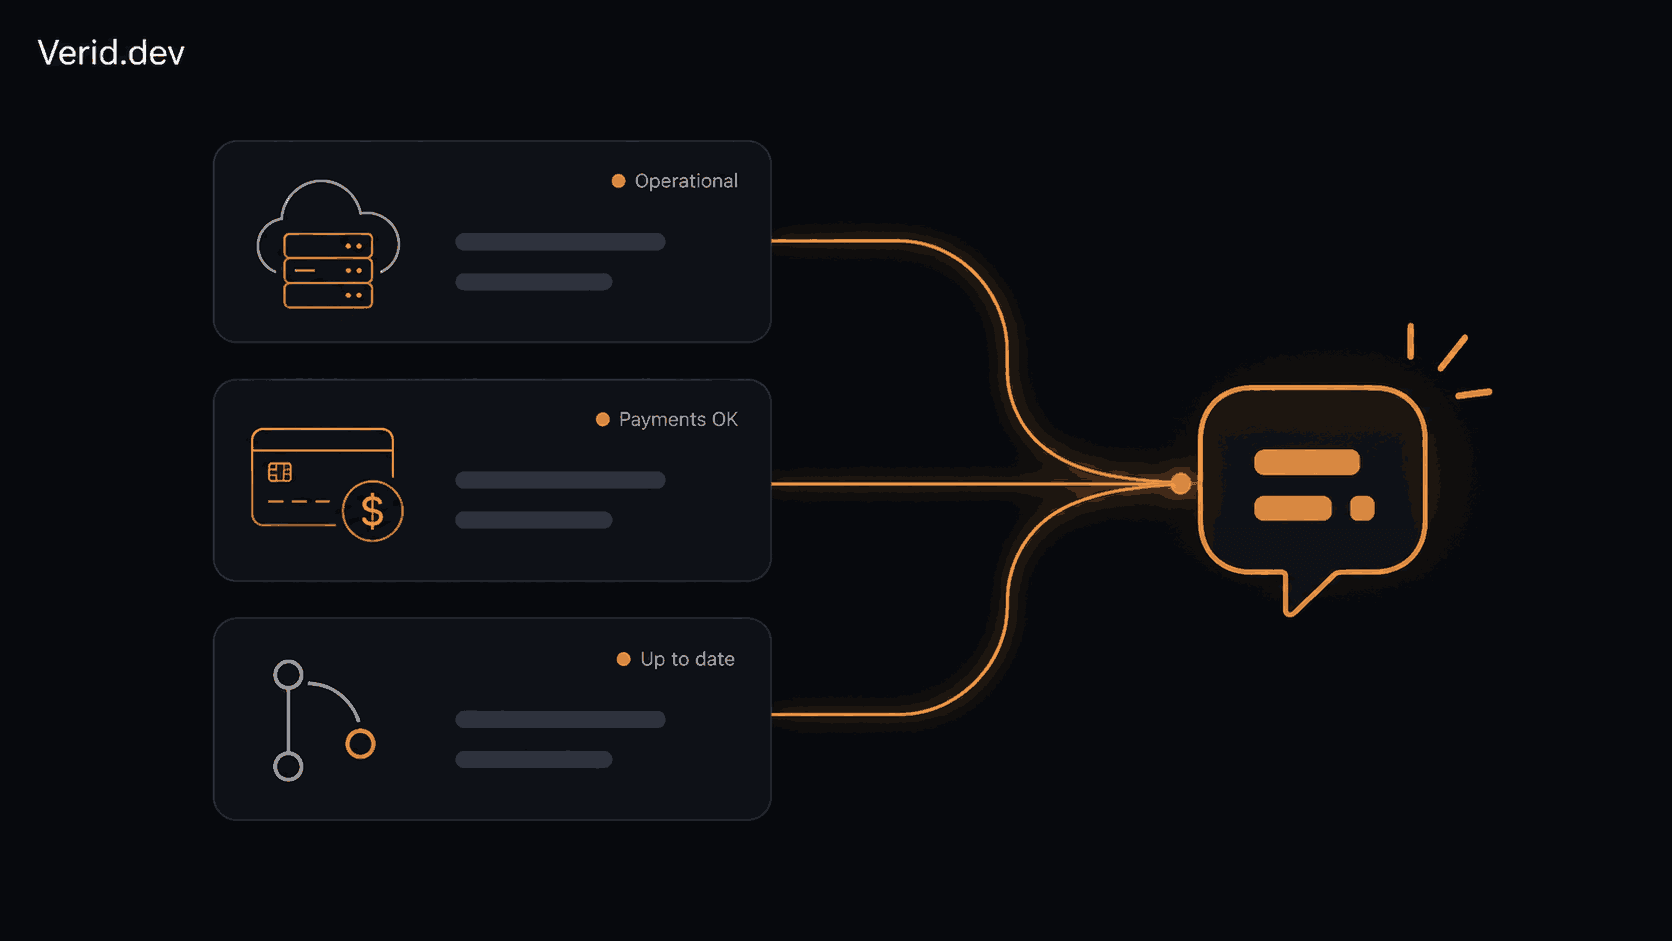
Monitor AWS, Stripe, and GitHub Status Pages and Route Incidents to Slack Automatically
Your app depends on services you do not control. When AWS has a regional blip, Stripe degrades, or GitHub Actions stalls, you usually find out the same way your users do: things just stop working. Then someone opens four browser tabs to figure out whose fault it is.
This guide covers a different approach: build status page monitors that watch the exact fields you care about and push incidents directly into Slack, with no polling scripts to maintain and no noisy "something changed" alerts for cookie banners or timestamps.
Why status page monitoring matters for engineering teams
Every status page eventually tells the truth, but it tells it on its own schedule. AWS, Stripe, and GitHub publish incidents through HTML pages and JSON feeds, not through a system designed to integrate with your stack. If you depend on these providers, you are choosing between three options: check pages manually, write a scraper, or pay for a tool built around your actual workflow.
Manual checking does not scale past a handful of services. A scraper works until the page changes a class name, drops a field, or moves to a JavaScript-rendered widget, and now you are debugging your monitoring instead of your product.
Common problems engineering teams face
A few patterns show up across most teams trying to solve this themselves.
Alert fatigue from full-page diffs. Watching an entire status page for any change means catching ad rotations, "last updated" timestamps, and layout tweaks alongside real incidents. The signal gets buried fast.
No way to scope by component. You depend on us-east-1, not all of AWS. Most homegrown scripts cannot distinguish a single affected region from a global outage, so every alert reads the same.
Brittle parsers. A CSS selector or regex tuned to today's status page markup breaks the next time the provider redesigns. Nobody notices until an incident goes unreported.
Disconnected from where the team works. Email digests and RSS feeds require someone to be watching. Incidents that should land in Slack within seconds instead sit in an inbox.
How Verid solves this
Verid is a developer-first web change-detection API built for exactly this kind of structured monitoring. Instead of asking "did the page change," you tell Verid which field matters and what condition counts as worth a notification.
A few capabilities map directly onto status page monitoring:
| Capability | Why it matters for status pages |
|---|---|
| Six extraction methods (CSS, XPath, JSONPath, regex, full-page hash, AI extraction) | Match the right method to each provider's page or status API format |
| Nine diff predicates | Fire only on the field and condition you define, not on any byte-level change |
| Three-layer fetching (HTTP, headless browser, residential proxy) | Status pages with JS-rendered widgets get resolved automatically |
| HMAC-signed webhooks, Slack, Discord, email | Route the same incident to your application and your team's channel |
| Ready-made AWS status page template | Skip manual config for one of the most common monitors teams ask for |
Verid ships a ready-made template for the AWS status page, so that specific monitor takes one API call rather than a from-scratch extraction config. Stripe and GitHub status pages are configured the same way as any other monitored URL, using JSONPath against their status APIs or CSS selectors against the rendered page.
Polling scripts vs webhook-driven monitoring
| Cron job + manual parser | Verid | |
|---|---|---|
| Setup time | Hours, plus ongoing maintenance | Minutes per monitor |
| Breaks when page markup changes | Yes, silently | Extraction methods and fetch strategy are maintained centrally |
| Component-level scoping | Requires custom logic | Built into the extraction config |
| Delivery retries | You build it | 6 automatic retries with exponential backoff |
| Routing to Slack | Custom webhook handler | Native Slack delivery type |
| Programmatic management | Custom scripts | Full REST API and Node.js SDK |
Step-by-step implementation
1. Create an account and get an API key
Start a 14-day free Verid trial, no credit card required. The trial includes unlimited monitors and 200 runs, which is enough to validate this setup with daily checks before choosing a paid plan.
2. Start from the AWS status page template
curl -X POST https://api.verid.dev/v1/templates \
  -H "Authorization: Bearer vrd_your_api_key"
List available templates first to confirm the current slug, then create a monitor from it:
curl -X POST https://api.verid.dev/v1/monitors/from-template/aws-status-page \
  -H "Authorization: Bearer vrd_your_api_key" \
  -H "Content-Type: application/json" \
  -d '{
    "name": "AWS us-east-1 status",
    "deliveries": [
      { "type": "slack", "webhookUrl": "https://hooks.slack.com/services/T000/B000/xxxx" }
    ]
  }'
3. Configure Stripe and GitHub monitors manually
Stripe and GitHub do not have a built-in template, so you define the extraction and predicate yourself using the Node.js SDK.
import { VeridClient } from '@verid.dev/sdk';

const client = new VeridClient({
  apiKey: process.env.VERID_API_KEY!,
});

const stripeMonitor = await client.monitors.create({
  name: 'Stripe API status',
  url: 'https://status.stripe.com/api/v2/status.json',
  schedule_interval_seconds: 300,
  extract_config: {
    method: 'json_path',
    fields: { status: '$.status.indicator' },
  },
  diff_predicate: {
    type: 'field_matches_regex',
    field: 'status',
    pattern: '^(minor|major|critical)',
  },
  deliveries: [
    { type: 'slack', webhookUrl: process.env.SLACK_WEBHOOK_URL! },
  ],
});

const githubMonitor = await client.monitors.create({
  name: 'GitHub Actions status',
  url: 'https://www.githubstatus.com/api/v2/components.json',
  schedule_interval_seconds: 300,
  extract_config: {
    method: 'json_path',
    fields: { actions_status: "$.components[?(@.name=='Actions')].status" },
  },
  diff_predicate: { type: 'field_changes', field: 'actions_status' },
  deliveries: [
    { type: 'slack', webhookUrl: process.env.SLACK_WEBHOOK_URL! },
  ],
});
This uses field_matches_regex for Stripe because their status indicator already reflects severity, and field_changes for GitHub Actions because any deviation from "operational" is worth a look. Both predicates are documented on Verid's change detection page, alongside seven others, including percentage and absolute thresholds for numeric fields.
4. Add a five-minute check interval for production dependencies
Daily checks are fine for evaluation, but a production incident pipeline should run on a tighter interval. A 300-second interval, as used above, balances responsiveness against request volume. Every plan, and the free trial, can check as often as every minute; what changes is your monthly runs. A 5-minute monitor uses about 8,640 runs a month, so the two above need about 17,280, which fits the Scale plan; at 15-minute intervals (about 2,880 runs each) they fit on Starter.
5. Verify webhook signatures if you also route to your own backend
If you want incidents to also hit an internal service, alongside Slack, add a webhook delivery and verify the signature server-side.
import { createHmac } from 'crypto';

function verifyVeridSignature(payload: string, header: string, secret: string): boolean {
  const [tPart, vPart] = header.split(',');
  const timestamp = tPart.split('=')[1];
  const signature = vPart.split('=')[1];
  const expected = createHmac('sha256', secret)
    .update(`${timestamp}.${payload}`)
    .digest('hex');
  return expected === signature;
}
Verid signs webhooks in the same t=...,v1=... format Stripe uses, so if you already have Stripe webhook verification in your codebase, the logic ports over almost unchanged.
Real-world workflow: from incident to Slack message
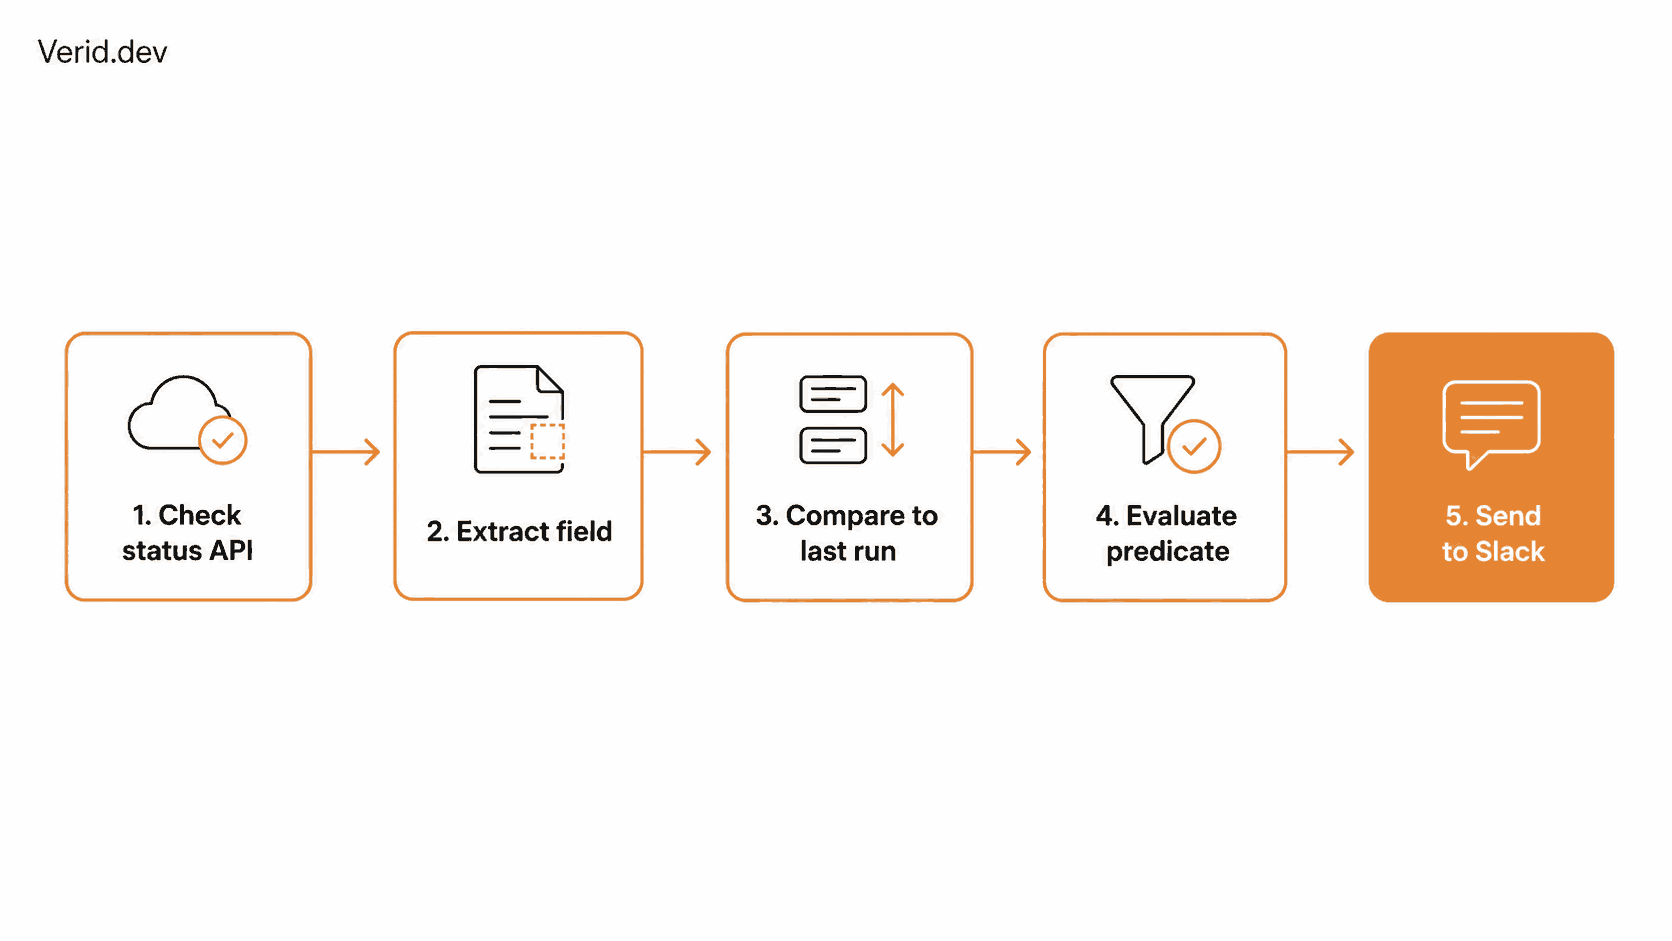
Here is what happens end to end once the monitors above are live.
- Verid checks the Stripe status JSON every five minutes and extracts
status.indicator. - The new value is compared against the last stored run.
- If the predicate evaluates true, in this case the indicator matches
minor,major, orcritical, a delivery fires. - Slack receives a formatted message naming the monitor, the field that changed, and a link to the full run.
- Anyone in the channel sees the incident within seconds of the underlying status page updating, without opening a single tab.
The same flow applies to the AWS and GitHub monitors, each posting to whichever channel makes sense, for example #aws-incidents for infrastructure and #deployments for GitHub Actions.
Slack alert routing best practices
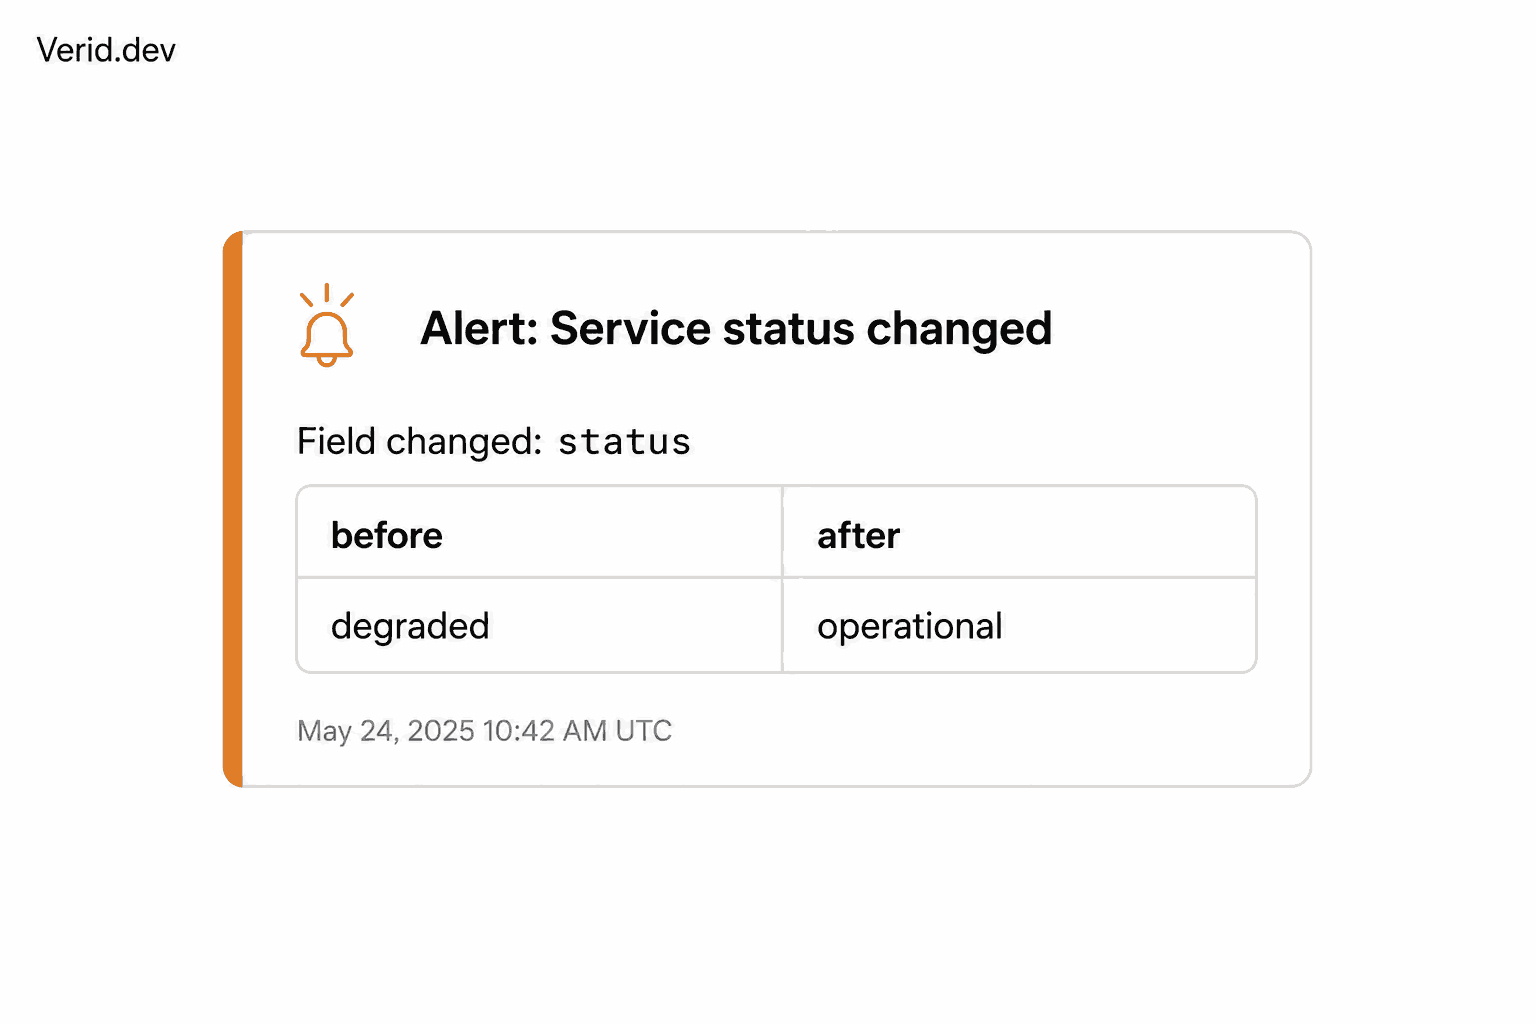
Separate channels by provider or severity. Route AWS infrastructure alerts to an ops channel and Stripe payment alerts to a channel your finance or support team also watches. Verid supports multiple delivery targets per monitor, so the same incident can post to more than one channel if needed.
Scope to the component you depend on, not the whole provider. Extract the specific field for your region or service rather than the page-wide status, so a eu-west-1 blip does not page your team for a dependency you do not use.
Use the right predicate for the signal. A binary "operational vs not" field works well with field_matches_regex or field_equals. A numeric field, like an error count, benefits more from a threshold predicate so minor noise does not trigger alerts.
Keep the first run in mind. Verid's first run on any new monitor establishes the baseline and does not fire a notification. Confirm your monitor by triggering a manual run if you want to validate the setup immediately rather than waiting for the next scheduled check.
Common mistakes
Monitoring the homepage instead of the status API. Most providers, including Stripe and GitHub, expose a structured JSON status endpoint built for this exact purpose. Extracting from it is more reliable than scraping rendered HTML.
Setting predicates too broad. An any_field_changes predicate on a page with several fields will fire on noise. Narrow it to the specific field once you know which one actually represents an incident.
Skipping signature verification. If you add a webhook delivery target on top of Slack, always verify the HMAC signature before trusting the payload. Treat it the same way you would treat any other third-party webhook.
No fallback channel. If Slack delivery fails, retries happen automatically, but it is worth also configuring an email delivery as a secondary channel for monitors tied to critical infrastructure.
Conclusion
Status page monitoring is a solved problem once you stop trying to maintain a custom scraper for every provider. Defining the field and the exact condition that matters, then letting delivery and retries happen automatically, removes the maintenance burden entirely. Whether you are watching AWS, Stripe, GitHub, or any other dependency with a status page, the pattern is the same: extract, set a predicate, route to Slack.
Verid's features page covers the full set of extraction methods and predicates if you want to go further than what is covered here, and the notifications documentation details Slack and Discord delivery configuration in more depth.
FAQ
Can I monitor a specific AWS region instead of the entire status page?
Yes. Scope your extraction to the field or component that represents your region rather than the page-wide status, so alerts only fire for the infrastructure you actually depend on.
Does Verid support Stripe's official status API?
Verid monitors any URL, including Stripe's public status JSON endpoint, using JSONPath extraction. There is no Stripe-specific integration required since the status API is a standard public endpoint.
What happens if a Slack delivery fails?
Verid retries failed deliveries automatically up to six times with exponential backoff before giving up, which covers most transient Slack API or network issues.
How is this different from a generic uptime monitor?
Uptime monitors check whether your own infrastructure is reachable. Status page monitoring tracks your upstream dependencies, so you know when a third-party outage, not your own code, is the cause of an incident.
About the author

Software Engineer & Technical Writer
Hanzala is a software engineer and technical writer covering web monitoring, automation and API design. He builds the integrations he documents, which is why the code samples in his posts tend to work on the first try.
More from HANZALA SALEEM →Related posts
Website Monitoring vs Uptime Monitoring: What's the Difference?
Uptime monitoring checks if a site is up. Website monitoring checks what it says. Learn the difference and when you need both.
Read the post →change detectionFree Website Change Monitors Compared (No Card Required)
Compare free website change monitors that need no credit card. Real limits, check frequency, and which tool actually fits your use case.
Read the post →visual monitoringVisual Regression Testing vs Visual Monitoring: Which Do You Need?
Visual regression testing catches bugs before release. Visual monitoring catches changes after deployment. Learn the difference and which one you need.
Read the post →comparisonApify Alternative for Scheduled Website Monitoring
Compare Apify Actors to a dedicated change monitoring API. See when building an Actor makes sense, and when webhooks on a rule get you there faster.
Read the post →